Shear Stress Calibration stand
Rendering of GDL's shear stress calibration stand.
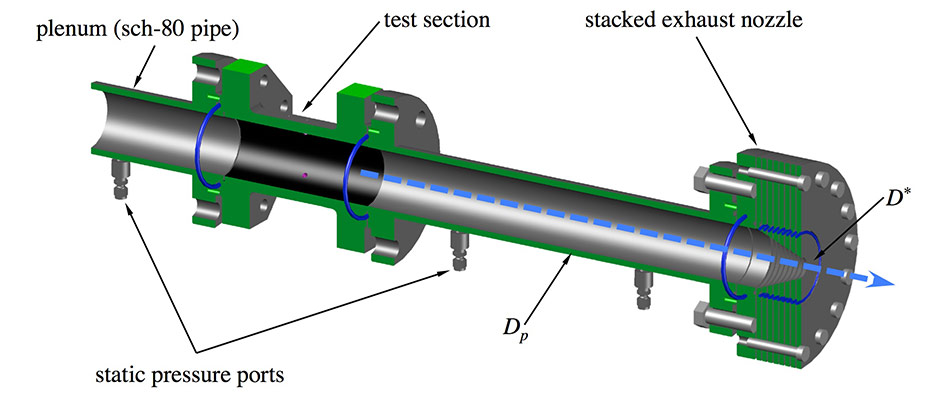
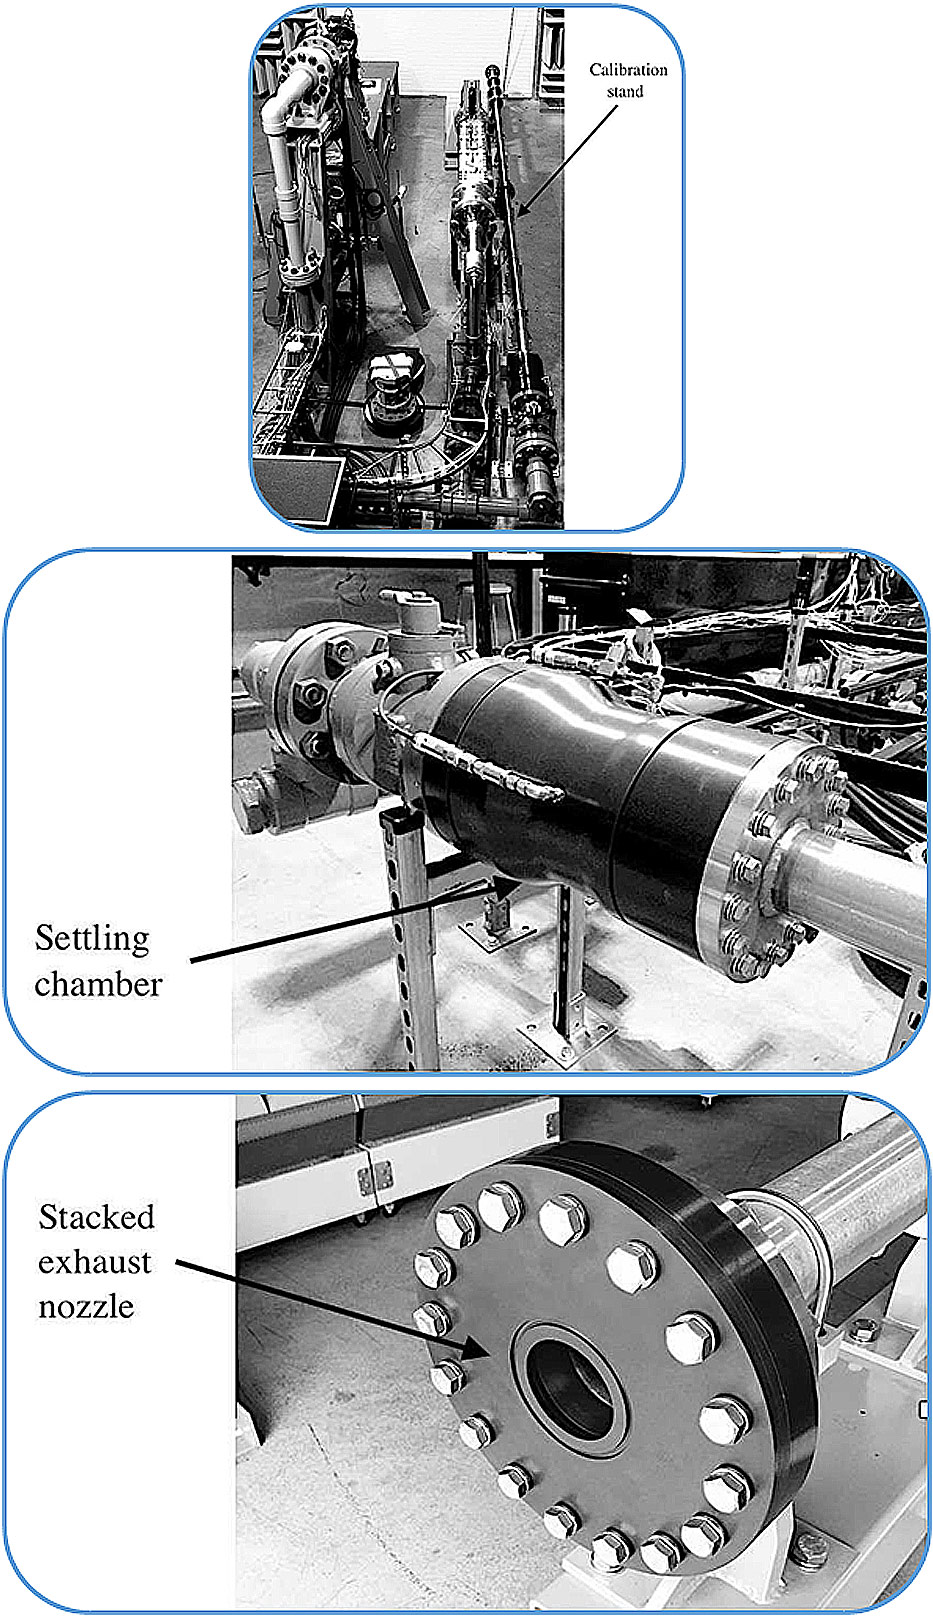
As part of a program sponsored by the Air-Force Research Labs, a calibration stand was designed and built by the GDL in 2018 to support the development of modern shear stress sensors at elevated pressures and temperatures. Its design is discussed in detail by Tinney & Valdez (2018) and relies on indirect methods for estimating the theoretical shear stress acting on the wall of a constant area pipe; its theoretical makeup is shown in Figure 1. The main components comprise three short (∼ 20 inch) and two long (∼ 119 inch) sections of pipe that are fastened using class 600 flanges as shown in Figures 2 and 3. The settling chamber and test section are machined from 6061 aluminum while the piping (extruded schedule 80 seamless pipe) and flanges are composed of 304 stainless steel. A dense honeycomb flow straightener is installed in the settling chamber (400 cells per square inch) in order to remove swirling motions from the isolation valve and upstream piping. Flange faces are custom machined to have seamless junctions between the pipe and flange as well as provisions for male/female connections for accurate alignment. O-rings are used to seal the flange faces while all sections of pipe were assembled and then honed using a flexible silicon carbide precision-finish cylinder hone. While the stainless steel pipe wall has a smooth finish relative to black carbon steel pipe, the honing was performed to ensure that adjoining pipe seems were smooth. An exhaust nozzle is configured using a series of orifice plates that can be stacked together to either increase of decrease the nozzle throat diameter. The range of throat diameters are from D∗ = 1.00 inch to 2.75 inch with 0.25 inch increments. Doing so provides a quick and inexpensive way of changing the throat diameter of the exhaust nozzle. A series of images of the new calibration stand installed on test stand 4 of the GDL is shown in Figure 4.
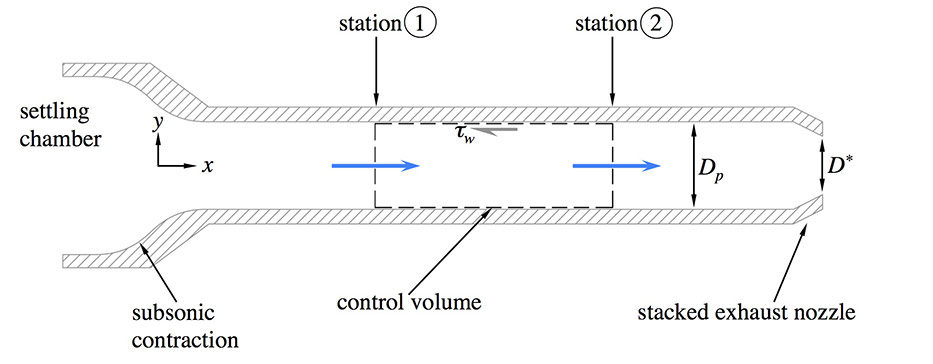
Figure 1: Control volume for flow through a constant area pipe.
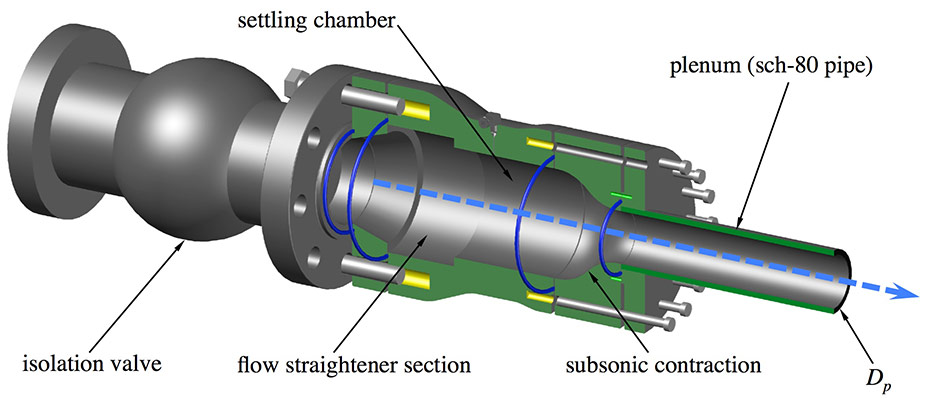
Figure 2: Schematic of the upstream flow conditioning section with isolation valve, flow straightener, settling chamber, subsonic contraction and pipe plenum.
Figure 3: Schematic of the downstream section with pipe plenum, test section and stacked exhaust nozzles.
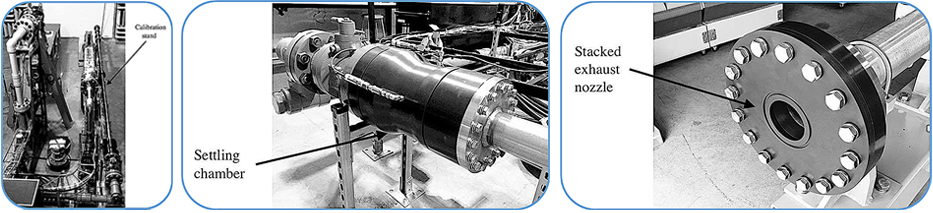
Figure 4: Images of the various components that make up the shear stress calibration stand.
A preliminary series of measurements with this new tunnel were conducted in the spring of 2018 to quantify the range of shear stress values that it could produce. These measurements were performed using a total of five gauge pressure transducers and a barometric transducer. The gauge transducers, with a 0-69bars (0-1000 psig) range, are the GT16 series made by Steller (+/-0.1% of full-scale output accuracy). Given the output of these transducers, the accuracy is reported to be +/-1psi. These accuracies were verified by pressurizing all transducers several times using one of the high-pressure gas lines in the GDL.
Several slow ramps of the new calibration tunnel to 500 psig (measured in the settling chamber) were then conducted using the larger diameter stackable nozzle (D∗ = 2.5inch). The larger nozzle equates to a larger plenum Mach number (around 0.5), according to calculations by Tinney & Valdez (2018) for Dp/D∗ = 1.170. Therefore, a larger range of shear stress values is expected to form. In Figure 5 (LHS), the drop in static wall pressure along the length of the plenum is illustrated for three different nozzle pressure ratios (NPR=10, 20 and 30). Each trend demonstrates how the static wall pressure decays linearly along the length of the plenum. Increasing nozzle pressure ratio is also shown to increase the rate at which the wall pressure drops, thereby confirming the findings from the model predictions. The entrance length has not yet been verified. To demonstrate that the pressure decay is not entirely linear we illustrate the change in pressure (dp/dx ) in Figure 5 (RHS) between two points in the flow for a range of nozzle pressure ratios. The steeper trend corresponds to pressure differences between points located at pressure taps 5 and 1, (ΔP5,1) and then taps 5 and 2 (ΔP5,2). The trend is nearly identical for these two cases where the developing regions of the flow are expected to reside. On the contrary, the lower trend, corresponding to ΔP10,6 and ΔP10,7, exhibits a shallower slope, which is believed to be the effect of the growing boundary layer and the collapse of the potential core.
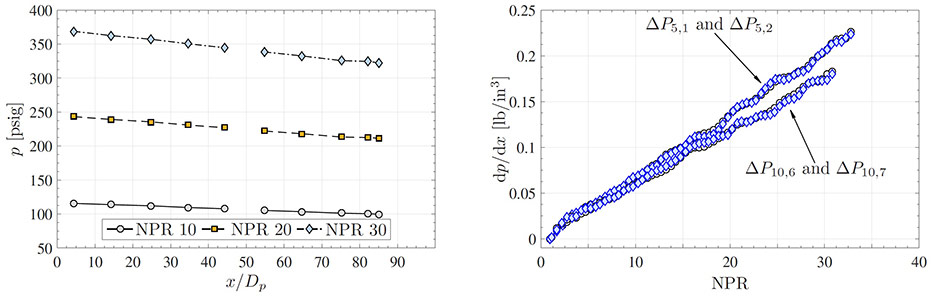
Figure 5: (LHS) Static wall pressure along the length of the plenum at three nozzle pressure ratios. (RHS) Change in pressure (dp/dx) at upstream and downstream locations in the plenum.
In Figure 6, the measured wall shear stresses are compared to the model predictions using Colebrook’s formula for commercial pipes and a roughness height of k/Dp = 2.17 x 10⁻⁷. The measured shear stresses are calculated from ΔP10,6 and ΔP10,7 where the flow is assumed to be fully developed. The slope of this trend is found to be valued at 0.3 kPa/NPR. As for the shear force acting on this section of the plenum, this is shown in Figure 6 (RHS) based on ΔP10,6 and ΔP10,7. Two trends are observed and are the result of the different lengths of pipe over which the shear stress is being integrated. That is, τ10,6 is acting on a longer section of the plenum denoted by L10,6 , whereas τ10,7 is acting on a shorter length of the plenum denoted by L10,7. The slopes of these lines equate roughly to 0.47 lbf./ft./NPR
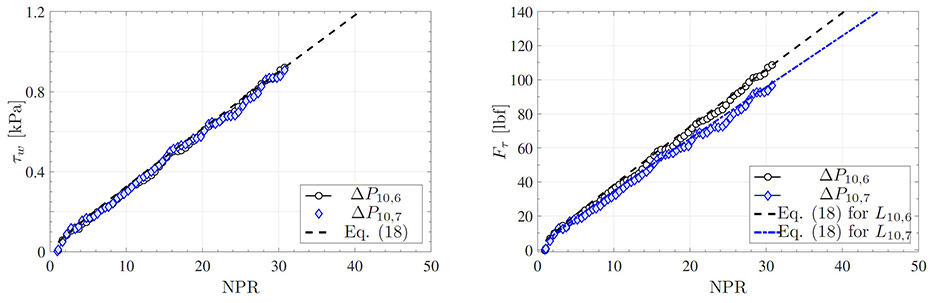
Figure 6: (LHS) Shear tress based on ΔP5,1 and ΔP5,2 and then ΔP10,6 and ΔP10,7, compared to the model. (RHS) Shear stress based on pressure differences between pressure tap transducers located at pressure tap.
- Tinney, Valdez (2018),
A new test stand for measuring wall shear stress,
AIAA Fluid Dynamics Conference, Atlanta, USA, Paper 2018-3085.